先日よりZabbix 2.2が公開されたわけですが、私の環境では常にiowaitが20~30%台をうろつく負荷状態でした。精神衛生上良くないので、自分でMySQLのチューニングなどを調べながらしてみたわけですが一向に改善せず、Twitterで呟いたところ、Zabbixではおなじみのくりゅー先生からアドバイスを頂けました。
@kometchtech 圧縮は試してます?
— 九龍真乙 (@qryuu) 2013, 12月 6
@kometchtech その設定を入れた上で対象のテーブルを指定して圧縮設定にする必要があります。やり方は自宅ラック勉強会2.2の資料に書いてあります。
— 九龍真乙 (@qryuu) 2013, 12月 6
InnoDBへの圧縮は入れていましたが、対象のテーブルに対して圧縮を掛ける必要があるのは知りませんでした。早速くりゅー先生謹製の下記資料を読んで圧縮の設定を入れてみることにしました。
検証環境
CentOS6.5 on KVM(Ubuntu 13.10)
# cat /etc/redhat-release
CentOS release 6.5 (Final)
# cat /proc/cpuinfo | grep processor
processor : 0
processor : 1
# free -m
total used free shared buffers cached
Mem: 3830 3253 577 0 132 1735
-/+ buffers/cache: 1385 2445
Swap: 4031 42 3989
# mysql --version
mysql Ver 14.14 Distrib 5.6.14, for Linux (x86_64) using EditLine wrappermysql> use zabbix
Reading table information for completion of table and column names
You can turn off this feature to get a quicker startup with -A
Database changed
mysql> alter table history ROW_FORMAT=COMPRESSED KEY_BLOCK_SIZE=8;
Query OK, 0 rows affected (12 min 56.34 sec)
Records: 0 Duplicates: 0 Warnings: 0
mysql> alter table history_log ROW_FORMAT=COMPRESSED KEY_BLOCK_SIZE=8;
Query OK, 0 rows affected (8.00 sec)
Records: 0 Duplicates: 0 Warnings: 0
mysql> alter table history_str ROW_FORMAT=COMPRESSED KEY_BLOCK_SIZE=8;
Query OK, 0 rows affected (18.63 sec)
Records: 0 Duplicates: 0 Warnings: 0
mysql> alter table history_text ROW_FORMAT=COMPRESSED KEY_BLOCK_SIZE=8;
Query OK, 0 rows affected (20.84 sec)
Records: 0 Duplicates: 0 Warnings: 0
mysql> alter table history_uint ROW_FORMAT=COMPRESSED KEY_BLOCK_SIZE=8;
Query OK, 0 rows affected (21 min 36.27 sec)
Records: 0 Duplicates: 0 Warnings: 0
mysql> alter table events ROW_FORMAT=COMPRESSED KEY_BLOCK_SIZE=8;
Query OK, 0 rows affected (34.28 sec)
Records: 0 Duplicates: 0 Warnings: 0
mysql> alter table trends ROW_FORMAT=COMPRESSED KEY_BLOCK_SIZE=8;
Query OK, 0 rows affected (35.93 sec)
Records: 0 Duplicates: 0 Warnings: 0
mysql> alter table trends_uint ROW_FORMAT=COMPRESSED KEY_BLOCK_SIZE=8;
Query OK, 0 rows affected (1 min 46.85 sec)
Records: 0 Duplicates: 0 Warnings: 0
mysql> alter table items ROW_FORMAT=COMPRESSED KEY_BLOCK_SIZE=8;
Query OK, 0 rows affected (3.77 sec)
Records: 0 Duplicates: 0 Warnings: 0
mysql> show table status like 'history'\G
*************************** 1. row ***************************
Name: history
Engine: InnoDB
Version: 10
Row_format: Compressed
Rows: 9346660
Avg_row_length: 31
Data_length: 294576128
Max_data_length: 0
Index_length: 132587520
Data_free: 524288
Auto_increment: NULL
Create_time: 2013-12-06 22:44:51
Update_time: NULL
Check_time: NULL
Collation: utf8_general_ci
Checksum: NULL
Create_options: row_format=COMPRESSED KEY_BLOCK_SIZE=8
Comment:
1 row in set (0.00 sec)
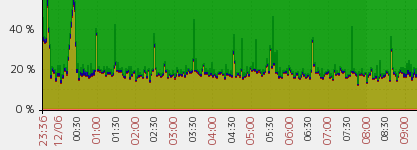
mysql> quit上記の設定を入れることで下記のような結果を得ることが出来ます。
@Toshihiro_SKK@kometchtech 圧縮すると書き込む前にデータ圧縮が走るので、CPU負荷があがりますが、iowaitが高いと言うことは、CPUはwait時間になっていると言うことなので、ディスクからCPUへ負荷を移転する意味があります
— 九龍真乙 (@qryuu) 2013, 12月 6
また、以下の様なアドバイスも頂いたので、さらにMySQL側にチューニングを入れることにしました。
@kometchtech@Toshihiro_SKK ただ30もあるとそもそもディスク性能が足りていない可能性もありますが、メモリがあるならキャッシュ設定を増やすと少しは改善するかも
— 九龍真乙 (@qryuu) 2013, 12月 6
[mysqld]
innodb_log_buffer_size=32M
innodb_buffer_pool_size=2G
innodb_log_file_size=256M
innodb_log_files_in_group=2
default-storage-engine=InnoDB
innodb_file_format=Barracuda
innodb_file_per_table=1
innodb_thread_concurrency=20
innodb_flush_log_at_trx_commit=2
innodb_support_xa=0
innodb_checksums=0
innodb_doublewrite=0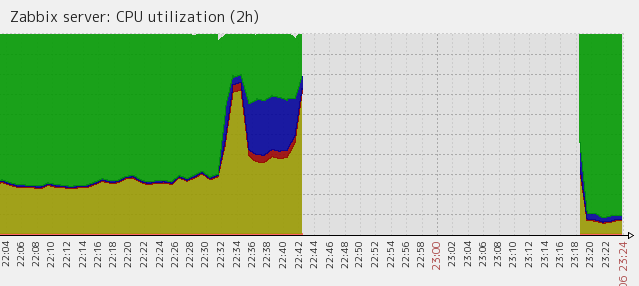
これを設定した上でMySQLを再起動させたところ、iowaitが最大30から5~8%まで下がる大幅な改善が見られました。
というわけで今回も毎度ながらくりゅー先生のお力添えの結果、大幅な改善をすることが出来ました。
本当にありがとうございました。
同じような問題で悩んでいらっしゃる方がいらっしゃいましたら、是非くりゅー先生の資料を参考にしながらチューニングしてみてください。