以前に上記のような記事を書いたのですが、以前の方法だとUserParameterで、監視項目数分、unbound-controlがkickされることになるので、以下の様なメッセージがlogに頻繁に出てくるのと、負荷が気になって来ました。
Jun 24 23:30:01 unbound[8176:0] info: control cmd: stats_noreset有効な監視項目は全てではないとはいえ、この数分unbound-controlを実行するのは負荷やタイムアウトの懸念から現実的では無いと思いました。
# unbound-control stats_noreset
thread0.num.queries=66
thread0.num.cachehits=52
thread0.num.cachemiss=14
thread0.num.prefetch=0
thread0.num.recursivereplies=14
thread0.requestlist.avg=2.21429
thread0.requestlist.max=6
thread0.requestlist.overwritten=0
thread0.requestlist.exceeded=0
thread0.requestlist.current.all=0
thread0.requestlist.current.user=0
thread0.recursion.time.avg=0.166255
thread0.recursion.time.median=0.065536
thread1.num.queries=198
thread1.num.cachehits=172
thread1.num.cachemiss=26
thread1.num.prefetch=0
thread1.num.recursivereplies=26
thread1.requestlist.avg=2.11538
thread1.requestlist.max=8
thread1.requestlist.overwritten=0
thread1.requestlist.exceeded=0
thread1.requestlist.current.all=0
thread1.requestlist.current.user=0
thread1.recursion.time.avg=0.198877
thread1.recursion.time.median=0.012288
total.num.queries=264
total.num.cachehits=224
total.num.cachemiss=40
total.num.prefetch=0
total.num.recursivereplies=40
total.requestlist.avg=2.15
total.requestlist.max=8
total.requestlist.overwritten=0
total.requestlist.exceeded=0
total.requestlist.current.all=0
total.requestlist.current.user=0
total.recursion.time.avg=0.187460
total.recursion.time.median=0.038912
time.now=1371663479.160258
time.up=136.026124
time.elapsed=136.026124
mem.total.sbrk=17035264
mem.cache.rrset=217221
mem.cache.message=119837
mem.mod.iterator=16532
mem.mod.validator=80340
histogram.000000.000000.to.000000.000001=0
histogram.000000.000001.to.000000.000002=0
histogram.000000.000002.to.000000.000004=0
histogram.000000.000004.to.000000.000008=0
histogram.000000.000008.to.000000.000016=0
histogram.000000.000016.to.000000.000032=0
histogram.000000.000032.to.000000.000064=0
histogram.000000.000064.to.000000.000128=0
histogram.000000.000128.to.000000.000256=0
histogram.000000.000256.to.000000.000512=0
histogram.000000.000512.to.000000.001024=0
histogram.000000.001024.to.000000.002048=0
histogram.000000.002048.to.000000.004096=4
histogram.000000.004096.to.000000.008192=14
histogram.000000.008192.to.000000.016384=2
histogram.000000.016384.to.000000.032768=1
histogram.000000.032768.to.000000.065536=1
histogram.000000.065536.to.000000.131072=1
histogram.000000.131072.to.000000.262144=6
histogram.000000.262144.to.000000.524288=5
histogram.000000.524288.to.000001.000000=6
histogram.000001.000000.to.000002.000000=0
histogram.000002.000000.to.000004.000000=0
histogram.000004.000000.to.000008.000000=0
histogram.000008.000000.to.000016.000000=0
histogram.000016.000000.to.000032.000000=0
histogram.000032.000000.to.000064.000000=0
histogram.000064.000000.to.000128.000000=0
histogram.000128.000000.to.000256.000000=0
histogram.000256.000000.to.000512.000000=0
histogram.000512.000000.to.001024.000000=0
histogram.001024.000000.to.002048.000000=0
histogram.002048.000000.to.004096.000000=0
histogram.004096.000000.to.008192.000000=0
histogram.008192.000000.to.016384.000000=0
histogram.016384.000000.to.032768.000000=0
histogram.032768.000000.to.065536.000000=0
histogram.065536.000000.to.131072.000000=0
histogram.131072.000000.to.262144.000000=0
histogram.262144.000000.to.524288.000000=0
num.query.type.A=69
num.query.type.PTR=133
num.query.type.AAAA=62
num.query.class.IN=264
num.query.opcode.QUERY=264
num.query.tcp=0
num.query.ipv6=12
num.query.flags.QR=0
num.query.flags.AA=0
num.query.flags.TC=0
num.query.flags.RD=264
num.query.flags.RA=0
num.query.flags.Z=0
num.query.flags.AD=0
num.query.flags.CD=0
num.query.edns.present=0
num.query.edns.DO=0
num.answer.rcode.NOERROR=198
num.answer.rcode.NXDOMAIN=66
num.answer.rcode.nodata=12
num.answer.secure=0
num.answer.bogus=0
num.rrset.bogus=0
unwanted.queries=0
unwanted.replies=0というわけで一括で値を取得する方法が無いかと探してみたところ、zabbix_senderという便利なコマンドがあることが分かりました。
また、以下の様なWebサイト様で実際に実施する方法が掲載されていたので、参考に作ってみることにしました。

というわけで、zabbix_senderを実行するために、データを必要な形に整形するスクリプトを書きます。
自分自身のスクリプト力が皆無なので、全然最適化されていないと思いますが、分かる人がいらっしゃいましたらご指摘頂けますと助かります。
#/bin/bash

UNIXTIME=" "`date '+%s'`" "
ZBX_SENDER="/usr/bin/zabbix_sender"
ZBX_SERVER="192.168.0.250"
ZBX_SERVER_PORT="10051"
HOSTNAME=`hostname`" "
UNBOUND_CTL="/usr/sbin/unbound-control"
TMP_FILE1=/tmp/unbound_stats_tmp
TMP_FILE2=/tmp/unbound_stats

${UNBOUND_CTL} stats_noreset > ${TMP_FILE1}
awk '{ print $1,$2 }' ${TMP_FILE1} > ${TMP_FILE2}
sed -i -e "s/=/${UNIXTIME}/" ${TMP_FILE2}
sed -i -e "s/^/${HOSTNAME}/" ${TMP_FILE2}

${ZBX_SENDER} -z ${ZBX_SERVER} -p ${ZBX_SERVER_PORT} -T -i ${TMP_FILE2}zabbix_senderコマンドの実行形式は以下のとおりです。
zabbix_sender -z <zabbixサーバ> -p <ポート> -T -i <入力ファイル>ファイルに以下のような形式で出力してやると、読み込んでくれてzabbix_senderでzabbixサーバに送信してくれます。
<hostname> <key> <timestamp> <value>
dns1.kometch.local zone.slave 1372085581 0シェルスクリプトは/etc/zabbix/externalscripts/のようなディレクトリを作成してそこに格納し、スクリプト自体は以下のようにして権限を変更しておきます。
chmod 755 /etc/zabbix/externalscripts/zbx_send_unbound.sh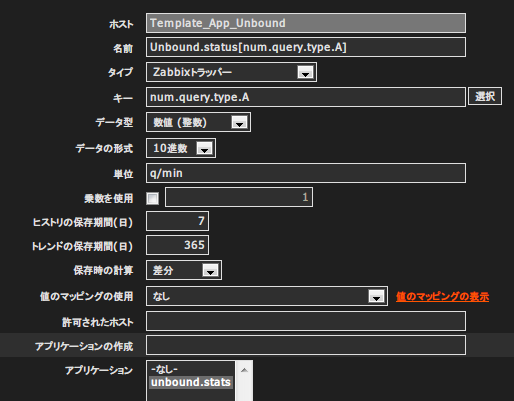
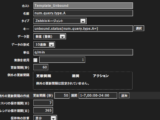
あとは以下の様な感じで、Zabbixサーバ側にアイテムを登録すれば良いと思います。
一度単独で実行し、問題なくZabbixサーバに結果が反映されていることを確認します。
/etc/zabbix/externalscripts/zbx_send_unbound.sh
info from server: "Processed 17 Failed 104 Total 121 Seconds spent 0.000972"
sent: 121; skipped: 0; total: 121
問題がないようであれば、cronに適切な時間で実行されるように登録します(以下の例では一分毎に実行されるようにしています)。
*/1 * * * * /etc/zabbix/externalscripts/zbx_send_unbound.shこれで、監視項目毎にunbound-controlを実行しないので、監視項目数が増えてもさほど負荷は増えないと思います。一応念のため、Zabbix Server側の負荷監視は当面注視しておこうと思います。