最近ハマりぎみのZabbixなのですが、普段キャッシュサーバとして使用しているUnboundの統計情報を監視するように設定してみることにしました。
手順
1. unbound-controlを有効にする。
control-enable: yes2. 拡張統計情報を出力できるようにする。
extended-statistics: yes3. unboundグループにzabbixユーザを追加する。
gpasswd -a zabbix unbound
Adding user zabbix to group unbound
POINT
これをしないと、unbound-controlを実行する権限がないと怒られてしまい、値が取得出来ません。
4. /etc/zabbix/zabbix_agentd.d配下に、以下のファイルを作成する。
userparameter_unbound.conf
UserParameter=unbound.status[*],/usr/sbin/unbound-control stats_noreset | grep -F "$1" | cut -d "=" -f2POINT
Zabbixのキー設定の値を代入して、それに該当する項目の値を引っ張ってくる仕様です。
ちなみに以下のような値が取得できるはずです。
unbound-control stats_noreset
thread0.num.queries=66
thread0.num.cachehits=52
thread0.num.cachemiss=14
thread0.num.prefetch=0
thread0.num.recursivereplies=14
thread0.requestlist.avg=2.21429
thread0.requestlist.max=6
thread0.requestlist.overwritten=0
thread0.requestlist.exceeded=0
thread0.requestlist.current.all=0
thread0.requestlist.current.user=0
thread0.recursion.time.avg=0.166255
thread0.recursion.time.median=0.065536
thread1.num.queries=198
thread1.num.cachehits=172
thread1.num.cachemiss=26
thread1.num.prefetch=0
thread1.num.recursivereplies=26
thread1.requestlist.avg=2.11538
thread1.requestlist.max=8
thread1.requestlist.overwritten=0
thread1.requestlist.exceeded=0
thread1.requestlist.current.all=0
thread1.requestlist.current.user=0
thread1.recursion.time.avg=0.198877
thread1.recursion.time.median=0.012288
total.num.queries=264
total.num.cachehits=224
total.num.cachemiss=40
total.num.prefetch=0
total.num.recursivereplies=40
total.requestlist.avg=2.15
total.requestlist.max=8
total.requestlist.overwritten=0
total.requestlist.exceeded=0
total.requestlist.current.all=0
total.requestlist.current.user=0
total.recursion.time.avg=0.187460
total.recursion.time.median=0.038912
time.now=1371663479.160258
time.up=136.026124
time.elapsed=136.026124
mem.total.sbrk=17035264
mem.cache.rrset=217221
mem.cache.message=119837
mem.mod.iterator=16532
mem.mod.validator=80340
histogram.000000.000000.to.000000.000001=0
histogram.000000.000001.to.000000.000002=0
histogram.000000.000002.to.000000.000004=0
histogram.000000.000004.to.000000.000008=0
histogram.000000.000008.to.000000.000016=0
histogram.000000.000016.to.000000.000032=0
histogram.000000.000032.to.000000.000064=0
histogram.000000.000064.to.000000.000128=0
histogram.000000.000128.to.000000.000256=0
histogram.000000.000256.to.000000.000512=0
histogram.000000.000512.to.000000.001024=0
histogram.000000.001024.to.000000.002048=0
histogram.000000.002048.to.000000.004096=4
histogram.000000.004096.to.000000.008192=14
histogram.000000.008192.to.000000.016384=2
histogram.000000.016384.to.000000.032768=1
histogram.000000.032768.to.000000.065536=1
histogram.000000.065536.to.000000.131072=1
histogram.000000.131072.to.000000.262144=6
histogram.000000.262144.to.000000.524288=5
histogram.000000.524288.to.000001.000000=6
histogram.000001.000000.to.000002.000000=0
histogram.000002.000000.to.000004.000000=0
histogram.000004.000000.to.000008.000000=0
histogram.000008.000000.to.000016.000000=0
histogram.000016.000000.to.000032.000000=0
histogram.000032.000000.to.000064.000000=0
histogram.000064.000000.to.000128.000000=0
histogram.000128.000000.to.000256.000000=0
histogram.000256.000000.to.000512.000000=0
histogram.000512.000000.to.001024.000000=0
histogram.001024.000000.to.002048.000000=0
histogram.002048.000000.to.004096.000000=0
histogram.004096.000000.to.008192.000000=0
histogram.008192.000000.to.016384.000000=0
histogram.016384.000000.to.032768.000000=0
histogram.032768.000000.to.065536.000000=0
histogram.065536.000000.to.131072.000000=0
histogram.131072.000000.to.262144.000000=0
histogram.262144.000000.to.524288.000000=0
num.query.type.A=69
num.query.type.PTR=133
num.query.type.AAAA=62
num.query.class.IN=264
num.query.opcode.QUERY=264
num.query.tcp=0
num.query.ipv6=12
num.query.flags.QR=0
num.query.flags.AA=0
num.query.flags.TC=0
num.query.flags.RD=264
num.query.flags.RA=0
num.query.flags.Z=0
num.query.flags.AD=0
num.query.flags.CD=0
num.query.edns.present=0
num.query.edns.DO=0
num.answer.rcode.NOERROR=198
num.answer.rcode.NXDOMAIN=66
num.answer.rcode.nodata=12
num.answer.secure=0
num.answer.bogus=0
num.rrset.bogus=0
unwanted.queries=0
unwanted.replies=0
5. 上記までの設定を有効にするため、以下のサービスを再起動する。
# /etc/init.d/zabbix-agent restart
Shutting down Zabbix agent:                                [  OK  ]
Starting Zabbix agent:                                     [  OK  ]
# /etc/init.d/unbound restart
Stopping unbound:                                          [  OK  ]
Starting unbound:                                          [  OK  ]
6. Zabbixサーバからzabbix_getを使用し、値が取得できることを確認する。
zabbix_get -s 192.168.1.249 -k unbound.status[num.query.type.AAAA]
747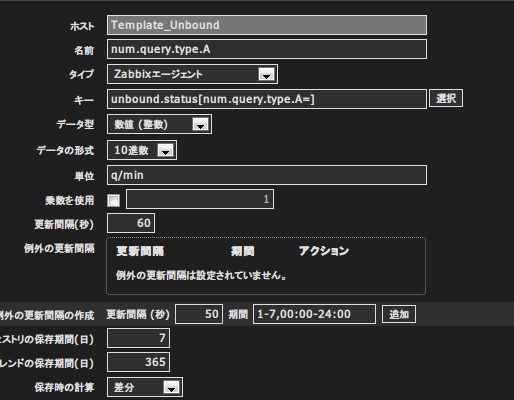
7. Zabbixのアイテムに以下の様な感じで必要分登録する。
POINT
保存時の計算は「差分」じゃないと正しい値が取得できないと思います。
6. グラフも追加登録する。
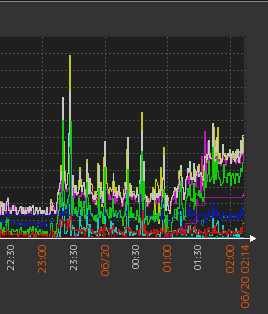
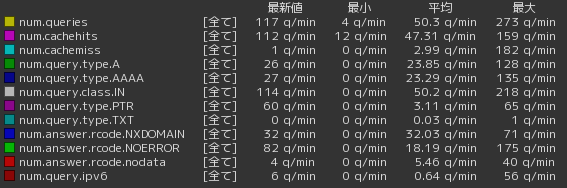
7. 値が取得できるようになると、以下の様な感じでホストから値が取得できるようになると思います。
これでUnboundのクエリやキャッシュヒット率などを視覚的に見ることが出来るようになるのではないでしょうか?
必要になるか分かりませんが、自分が作ったテンプレートを以下に置いておきますのでご自由にお使いください。また、変なところがあればご指摘頂けますと助かります。

zabbix_template/dns_stats_zabbix_sender/unbound at master · kometchtech/zabbix_template
zabbix template. Contribute to kometchtech/zabbix_template development by creating an account on GitHub.
github.com