一歩進んだ監視のカスタマイズ
この連載では、オープンソースの運用監視ソフトウェア「ZABBIX」ではどんなことができるのかを、実際の使い方とともに紹介していきます(編集部)
atmarkit.itmedia.co.jp
参考にしたのは上記のWebサイトのままですが。
確認環境:
% cat /etc/redhat-release
CentOS release 6.4 (Final)
手順
まずは温度が取得できるよう以下のパッケージを導入する。
yum install lm_sensors導入ができたら、以下のコマンドを実行し、センサーを認識させる。
yes | sensor-detectセンサーから値が取得できたか、以下のコマンドを実行し確認する。
% sensors -u
acpitz-virtual-0
Adapter: Virtual device
temp1:
temp1_input: 57.00
temp1_crit: 127.00
temp2:
temp2_input: 55.00
temp2_crit: 104.00

thinkpad-isa-0000
Adapter: ISA adapter
fan1:
fan1_input: 3668.00
temp1:
temp1_input: 57.00
temp2:
temp2_input: 55.00
temp3:
ERROR: Can't get value of subfeature temp3_input: Can't read
temp4:
temp4_input: 52.00
temp5:
temp5_input: 39.00
temp6:
ERROR: Can't get value of subfeature temp6_input: Can't read
temp7:
temp7_input: 37.00
temp8:
ERROR: Can't get value of subfeature temp8_input: Can't read
temp9:
temp9_input: 51.00
temp10:
temp10_input: 56.00
temp11:
ERROR: Can't get value of subfeature temp11_input: Can't read
temp12:
ERROR: Can't get value of subfeature temp12_input: Can't read
temp13:
ERROR: Can't get value of subfeature temp13_input: Can't read
temp14:
ERROR: Can't get value of subfeature temp14_input: Can't read
temp15:
ERROR: Can't get value of subfeature temp15_input: Can't read
temp16:
ERROR: Can't get value of subfeature temp16_input: Can't read

coretemp-isa-0000
Adapter: ISA adapter
Core 0:
temp2_input: 55.00
temp2_max: 105.00
temp2_crit: 105.00
temp2_crit_alarm: 0.00
Core 1:
temp3_input: 55.00
temp3_max: 105.00
temp3_crit: 105.00
temp3_crit_alarm: 0.00ここで必要なのは、coretemp-isa-0000のtemp2_inputとtemp3_inputなので、ワンライナーで必要な部分を切り出します。
sensors -u coretemp-isa-0000 | grep temp2_input | cut -d ":" -f2 | cut -d " " -f2
sensors -u coretemp-isa-0000 | grep temp3_input | cut -d ":" -f2 | cut -d " " -f2切り出せたことを確認したら、/etc/zabbix/zabbix_agentd.d 配下にuserparameter_coretemp.confなどのファイルを作成し、以下のように記述する。
UserParameter=sensors.fan[*],sensors -u | grep fan1_input | cut -d ":" -f2 | cut -d " " -f2
UserParameter=sensors.coretemp1,sensors -u coretemp-isa-0000 | grep temp2_input | cut -d ":" -f2 | cut -d " " -f2
UserParameter=sensors.coretemp2,sensors -u coretemp-isa-0000 | grep temp3_input | cut -d ":" -f2 | cut -d " " -f2
※ファン回転数も入っているのは気にしないでください。
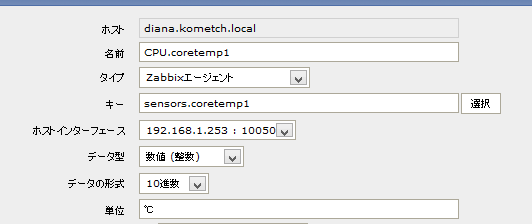
Zabbix側で、対象のホストを選択し、アイテムの作成から以下のようにパラメータを設定する。
キーには、UserParameter=から,(カンマ)までに設定した文字列を指定する。
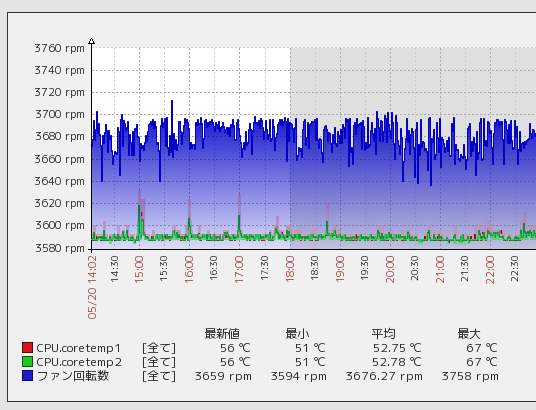
グラフの設定も同様に行いうまく値が取得できていると、以下の様なグラフで出力されると思います。
これでSNMPなどに対応していなくても、Zabbix Agentさえ導入していれば値を取得し、システム監視ができるようになると思います。