
Linuxを使っていてネットワークの統計情報?を見たりする際にはifstatやdstatを使用したり、それ以上詳しい情報として欲しい場合はnagiosやcacti、Zabbixなどの監視ツールを使用したりすると思います。
が、CLIでとりあえずサクッと情報を取得するのに便利なパッケージがありました。
本家サイトによると、
- quick and simple to install and get running
- gathered statistics persists through system reboots
- can monitor multiple interfaces at the same time
- several output options
- summary, hourly, daily, monthly, weekly, top 10 days
- optional png image output (using libgd)
- months can be configured to follow billing period
- light, minimal resource usage
- same low cpu usage regardless of traffic
- can be used without root permissions
- online color configuration editor
また統計情報を時間毎、日時、月次、週次、または10日の単位で出力可能。また最近のAPI好きな方には朗報のJSONにも対応しています。
# ただしJSON出力についてはちょっとParseできないところにカンマがあったりするので、問題なのかなぁ・・・ Gitの方は既に修正済みとのこと。
確認環境:
# cat /etc/redhat-release
CentOS Linux release 7.1.1503 (Core)
導入手順
1. 導入(事前にgccパッケージが必要です)
# yum install gcc gd-devel
# wget http://humdi.net/vnstat/vnstat-1.13.tar.gz
# tar zxf vnstat-1.13.tar.gz
# cd vnstat-1.13/
# make all
# make install
Installing vnStat...
Installing config to /etc//vnstat.conf
install -d -m 755 /usr/bin /usr/sbin /usr/share/man/man1 /usr/share/man/man5
install -s -m 755 src/vnstat /usr/bin
install -s -m 755 src/vnstatd /usr/sbin
install -s -m 755 src/vnstati /usr/bin
install -m 644 man/vnstat.1 /usr/share/man/man1
install -m 644 man/vnstatd.1 /usr/share/man/man1
install -m 644 man/vnstat.conf.5 /usr/share/man/man5
install -m 644 man/vnstati.1 /usr/share/man/man1

No service file or startup script has been installed. See the
INSTALL document for instructions on how to enable vnStat.
2. これで導入は終了。しかし、統計情報をためておくためのディレクトリを作成する必要があります。
# vnstat
Error: Unable to open database directory "/var/lib/vnstat": No such file or directory
The vnStat daemon should have created this directory when started.
Check that it is is configured and running. See also "man vnstatd".
# mkdir -p /var/lib/vnstat
3. ネットワークインターフェースのためのデータベースを事前に作成します。
# vnstat --create -i eth0
Creating database for interface "eth0"...
Info: -> A new database has been created.

Restart the vnStat daemon if it is currently running in order to start monitoring "eth0".
4. これに合わせて設定ファイルが以下の場所に作成されます。詳細については本家サイトを参照してください。
/etc/vnstat.conf

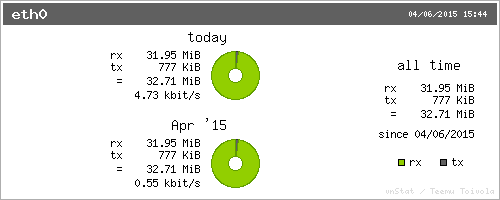
5. とりあえず情報を確認するのは以下のコマンドを実行。
# vnstat
Database updated: Mon Apr 6 15:27:53 2015

eth0 since 04/06/2015

rx: 27.44 MiB tx: 474 KiB total: 27.90 MiB

monthly
rx | tx | total | avg. rate
------------------------+-------------+-------------+---------------
Apr '15 27.44 MiB | 474 KiB | 27.90 MiB | 0.47 kbit/s
------------------------+-------------+-------------+---------------
estimated -- | -- | -- |

daily
rx | tx | total | avg. rate
------------------------+-------------+-------------+---------------
today 27.44 MiB | 474 KiB | 27.90 MiB | 4.11 kbit/s
------------------------+-------------+-------------+---------------
estimated -- | -- | -- |
時間ごとの統計は以下の様な感じ。
# vnstat -h
eth0 15:27
^ r
| r
| r
| r
| r
| r
| r
| r
| r
| r
-+--------------------------------------------------------------------------->
| 16 17 18 19 20 21 22 23 00 01 02 03 04 05 06 07 08 09 10 11 12 13 14 15

h rx (KiB) tx (KiB) h rx (KiB) tx (KiB) h rx (KiB) tx (KiB)
16 0 0 00 0 0 08 0 0
17 0 0 01 0 0 09 0 0
18 0 0 02 0 0 10 0 0
19 0 0 03 0 0 11 0 0
20 0 0 04 0 0 12 0 0
21 0 0 05 0 0 13 0 0
22 0 0 06 0 0 14 0 0
23 0 0 07 0 0 15 28,098 474
6. 用意されているオプションは以下の感じ。
vnStat 1.13 by Teemu Toivola <tst fi="" dot="" iki="" at="">
-q, --query query database
-h, --hours show hours
-d, --days show days
-m, --months show months
-w, --weeks show weeks
-t, --top10 show top10
-s, --short use short output
-u, --update update database
-i, --iface select interface (default: eth0)
-?, --help short help
-v, --version show version
-tr, --traffic calculate traffic
-ru, --rateunit swap configured rate unit
-l, --live show transfer rate in real time

See also "--longhelp" for complete options list and "man vnstat".
7. このままだとOSの再起動の際には自動的に情報収集を行わないので、以下の作業を実施し、systemdに登録する必要があります。
# cp -v examples/systemd/vnstat.service /etc/systemd/system/
# systemctl enable vnstat
# systemctl start vnstat
(CentOS6などを使用している場合は、以下のように作業してください。)
# cp -v examples/init.d/redhat/vnstat /etc/init.d/
# chkconfig vnstat on
# service vnstat start
8. CLIだけでは味気ない、資料に使用したいなどの場合は、vnstatiという画像生成コマンドが準備されています。
# vnstati -s -i eth0 -o ~/network-log1.png
# vnstati -h -i eth0 -o ~/network-log2.png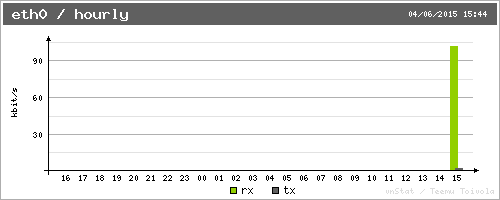
詳細はmanが用意されているので、こちらも参照してください。

監視ツールとは違う感じに使えると思いますが、いかがでしょうか?

森北出版 (2015-04-08)
売り上げランキング: 349357

ソフトバンククリエイティブ
売り上げランキング: 2795

